
|
MethodsCollecting the data (2011-2013)

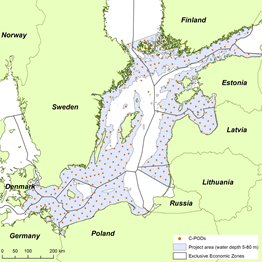
The C-POD study area stretched from the Darss and Limhamn ridges in the southwest to the northern border of the Åland archipelago in the north. This area includes waters of Sweden, Denmark, Germany, Poland, Lithuania, Latvia, Estonia and Finland. During the two year of data collection, the C-PODs were serviced every 3-4 months to change batteries and replace the SD card where the data is stored. Additional information is necessary for the density analysis. Firstly, porpoise click detectability was determined during an intensive study at one site, where porpoises were tracked acoustically using a sophisticated hydrophone array system. This made it possible to determine the effect of porpoise distance on the detection of clicks by the C-PODs. The wider applicability of this study was determined in a second study where playbacks of artificial porpoise clicks were undertaken at many of the C-POD locations in the Baltic. Lastly, average echolocation click rate was obtained by tagging harbour porpoises, opportu-nistically entrapped in Danish pound nets, with acoustic recording devices.
Analyzing the data (2013-2014)Density analysisThe porpoise click detections from the 298 C-POD locations that yielded data, were processed using a computer algorithm designed by the SAMBAH team to exclude other confounding sounds. This generated counts of the number of seconds with porpoise detection per month at each location. The additional acoustic tracking and playback data were used to estimate the effective detection area for each location and month. Combining the count of detections with the area surveyed gave a density estimate. The local densities around each C-POD were then used to calculate average density and abundance by season for the whole study area and for the national waters of each of the participating countries. Habitat modelinThe local density estimates are being used to model harbour porpoise spatial distribution. One important goal is to investigate if the porpoises show any habitat preferences. Various environmental factors (e.g. water depth, bottom type and slope, salinity, temperature, water current) are taken into consideration, and possible hotspots are being determined. By combining these results with available data on anthropogenic activities (e.g. fishing, tourism, shipping) it will be possible to pinpoint any areas with higher risk of conflict, and hence to determine if there is need for targeted protective measures. |

